Turkey construction confidence index
Construction confidence index (seasonally adjusted) · Turkish Statistical Institute
Short answer
83.3
October 2026 +0.3 pp
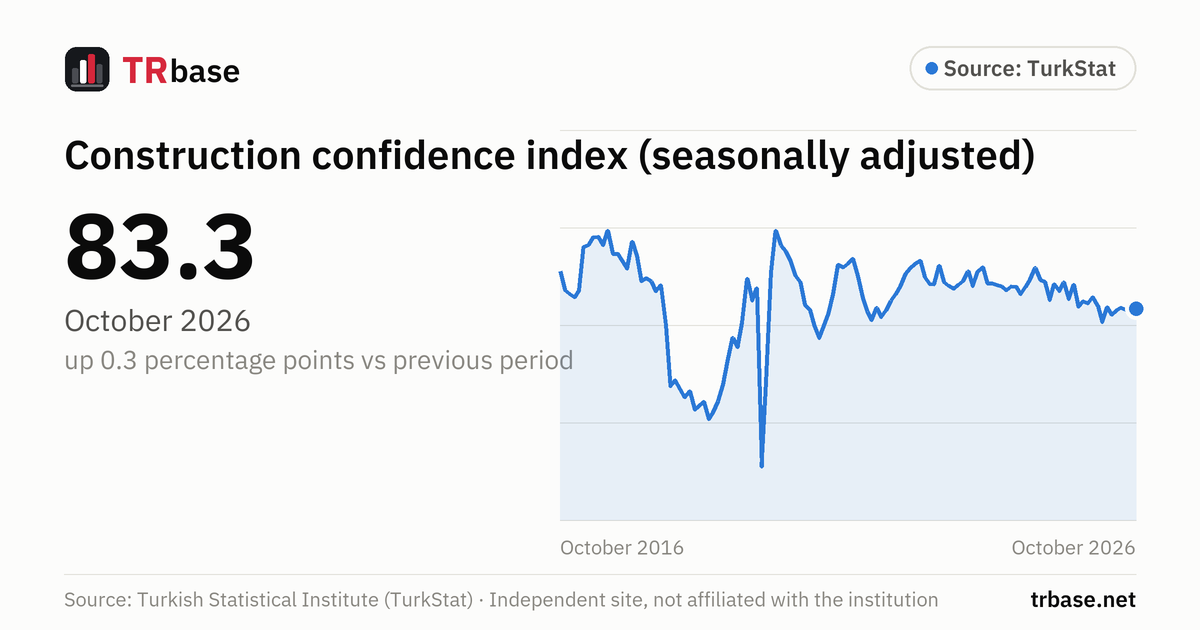
According to TurkStat, the seasonally adjusted construction confidence index was 83.3 in October 2026. That is up 0.3 percentage points from the previous month.
- A year earlier (October 2025) it was 83.7; the latest value is 0.4 percentage points lower.
Next release: Tuesday 24 November 2026, 10:00
Construction confidence index (seasonally adjusted), January 2011 – October 2026
Unit: index. Source: Turkish Statistical Institute (TurkStat). Hover over the chart, or focus it and use the arrow keys.
Data table
All values in the chart, newest first. Unit: index.
| Period | Construction confidence (index) | Change vs previous period |
|---|---|---|
| October 2026 | 83.3 | +0.3 pp |
| September 2026 | 83.0 | −0.1 pp |
| August 2026 | 83.1 | −0.4 pp |
| July 2026 | 83.5 | +0.5 pp |
| June 2026 | 83.0 | +0.9 pp |
| May 2026 | 82.1 | −1.5 pp |
| April 2026 | 83.6 | +3.0 pp |
| March 2026 | 80.6 | −3.3 pp |
| February 2026 | 83.9 | −1.8 pp |
| January 2026 | 85.7 | +1.2 pp |
| December 2025 | 84.5 | −0.4 pp |
| November 2025 | 84.9 | +1.2 pp |
| October 2025 | 83.7 | −4.6 pp |
| September 2025 | 88.3 | +3.0 pp |
| August 2025 | 85.3 | −3.5 pp |
| July 2025 | 88.8 | +1.9 pp |
| June 2025 | 86.9 | −1.5 pp |
| May 2025 | 88.4 | +3.3 pp |
| April 2025 | 85.1 | −3.8 pp |
| March 2025 | 88.9 | −0.4 pp |
| February 2025 | 89.3 | −2.4 pp |
| January 2025 | 91.7 | +2.3 pp |
| December 2024 | 89.4 | +1.6 pp |
| November 2024 | 87.8 | +1.5 pp |
| October 2024 | 86.3 | −1.5 pp |
| September 2024 | 87.8 | −0.2 pp |
| August 2024 | 88.0 | +0.9 pp |
| July 2024 | 87.1 | −0.8 pp |
| June 2024 | 87.9 | −0.4 pp |
| May 2024 | 88.3 | −0.3 pp |
| April 2024 | 88.6 | 0.0 pp |
| March 2024 | 88.6 | −3.2 pp |
| February 2024 | 91.8 | +0.9 pp |
| January 2024 | 90.9 | +2.9 pp |
| December 2023 | 88.0 | −3.0 pp |
| November 2023 | 91.0 | +1.9 pp |
| October 2023 | 89.1 | +0.8 pp |
| September 2023 | 88.3 | +0.9 pp |
| August 2023 | 87.4 | −0.7 pp |
| July 2023 | 88.1 | −0.8 pp |
| June 2023 | 88.9 | −3.3 pp |
| May 2023 | 92.2 | +3.8 pp |
| April 2023 | 88.4 | −0.1 pp |
| March 2023 | 88.5 | −1.3 pp |
| February 2023 | 89.8 | −3.4 pp |
| January 2023 | 93.2 | +0.6 pp |
| December 2022 | 92.6 | +1.0 pp |
| November 2022 | 91.6 | +1.1 pp |
| October 2022 | 90.5 | +2.4 pp |
| September 2022 | 88.1 | +1.8 pp |
| August 2022 | 86.3 | +1.3 pp |
| July 2022 | 85.0 | +2.0 pp |
| June 2022 | 83.0 | +1.4 pp |
| May 2022 | 81.6 | −1.9 pp |
| April 2022 | 83.5 | +2.5 pp |
| March 2022 | 81.0 | −1.7 pp |
| February 2022 | 82.7 | −2.8 pp |
| January 2022 | 85.5 | −4.5 pp |
| December 2021 | 90.0 | −3.6 pp |
| November 2021 | 93.6 | +0.9 pp |
| October 2021 | 92.7 | +0.9 pp |
| September 2021 | 91.8 | −0.6 pp |
| August 2021 | 92.4 | +6.1 pp |
| July 2021 | 86.3 | +3.9 pp |
| June 2021 | 82.4 | +2.8 pp |
| May 2021 | 79.6 | +2.3 pp |
| April 2021 | 77.3 | −2.5 pp |
| March 2021 | 79.8 | −3.3 pp |
| February 2021 | 83.1 | −1.1 pp |
| January 2021 | 84.2 | −4.6 pp |
| December 2020 | 88.8 | −1.3 pp |
| November 2020 | 90.1 | −3.1 pp |
| October 2020 | 93.2 | −1.9 pp |
| September 2020 | 95.1 | −1.3 pp |
| August 2020 | 96.4 | −2.9 pp |
| July 2020 | 99.3 | +8.5 pp |
| June 2020 | 90.8 | +22.5 pp |
| May 2020 | 68.3 | +17.4 pp |
| April 2020 | 50.9 | −36.6 pp |
| March 2020 | 87.5 | +2.5 pp |
| February 2020 | 85.0 | −4.5 pp |
| January 2020 | 89.5 | +9.0 pp |
| December 2019 | 80.5 | +5.1 pp |
| November 2019 | 75.4 | −2.0 pp |
| October 2019 | 77.4 | +4.8 pp |
| September 2019 | 72.6 | +4.9 pp |
| August 2019 | 67.7 | +3.3 pp |
| July 2019 | 64.4 | +2.3 pp |
| June 2019 | 62.1 | +1.4 pp |
| May 2019 | 60.7 | −3.6 pp |
| April 2019 | 64.3 | +1.0 pp |
| March 2019 | 63.3 | +0.7 pp |
| February 2019 | 62.6 | −3.8 pp |
| January 2019 | 66.4 | +1.2 pp |
| December 2018 | 65.2 | −1.6 pp |
| November 2018 | 66.8 | −1.9 pp |
| October 2018 | 68.7 | +1.3 pp |
| September 2018 | 67.4 | −12.6 pp |
| August 2018 | 80.0 | −8.2 pp |
| July 2018 | 88.2 | +1.3 pp |
| June 2018 | 86.9 | −2.1 pp |
| May 2018 | 89.0 | −0.6 pp |
| April 2018 | 89.6 | +0.6 pp |
| March 2018 | 89.0 | −5.2 pp |
| February 2018 | 94.2 | −2.9 pp |
| January 2018 | 97.1 | +5.6 pp |
| December 2017 | 91.5 | −1.7 pp |
| November 2017 | 93.2 | −1.4 pp |
| October 2017 | 94.6 | 0.0 pp |
| September 2017 | 94.6 | −4.7 pp |
| August 2017 | 99.3 | +2.9 pp |
| July 2017 | 96.4 | −1.7 pp |
| June 2017 | 98.1 | +0.1 pp |
| May 2017 | 98.0 | +1.5 pp |
| April 2017 | 96.5 | +0.4 pp |
| March 2017 | 96.1 | +9.0 pp |
| February 2017 | 87.1 | +1.4 pp |
| January 2017 | 85.7 | −0.7 pp |
| December 2016 | 86.4 | −0.8 pp |
| November 2016 | 87.2 | −3.8 pp |
| October 2016 | 91.0 | −1.4 pp |
| September 2016 | 92.4 | +1.7 pp |
| August 2016 | 90.7 | −2.6 pp |
| July 2016 | 93.3 | +1.2 pp |
| June 2016 | 92.1 | +1.2 pp |
| May 2016 | 90.9 | −1.1 pp |
| April 2016 | 92.0 | 0.0 pp |
| March 2016 | 92.0 | −1.9 pp |
| February 2016 | 93.9 | −1.4 pp |
| January 2016 | 95.3 | 0.0 pp |
| December 2015 | 95.3 | −0.6 pp |
| November 2015 | 95.9 | +5.6 pp |
| October 2015 | 90.3 | −1.1 pp |
| September 2015 | 91.4 | −2.1 pp |
| August 2015 | 93.5 | +0.2 pp |
| July 2015 | 93.3 | −3.0 pp |
| June 2015 | 96.3 | +0.8 pp |
| May 2015 | 95.5 | +3.6 pp |
| April 2015 | 91.9 | −2.1 pp |
| March 2015 | 94.0 | −1.6 pp |
| February 2015 | 95.6 | +2.0 pp |
| January 2015 | 93.6 | +0.9 pp |
| December 2014 | 92.7 | −1.0 pp |
| November 2014 | 93.7 | +1.7 pp |
| October 2014 | 92.0 | −3.1 pp |
| September 2014 | 95.1 | +1.4 pp |
| August 2014 | 93.7 | +3.6 pp |
| July 2014 | 90.1 | −1.7 pp |
| June 2014 | 91.8 | 0.0 pp |
| May 2014 | 91.8 | +2.0 pp |
| April 2014 | 89.8 | +1.2 pp |
| March 2014 | 88.6 | −3.3 pp |
| February 2014 | 91.9 | −7.5 pp |
| January 2014 | 99.4 | +6.8 pp |
| December 2013 | 92.6 | −2.2 pp |
| November 2013 | 94.8 | −0.6 pp |
| October 2013 | 95.4 | +2.1 pp |
| September 2013 | 93.3 | −1.6 pp |
| August 2013 | 94.9 | +0.4 pp |
| July 2013 | 94.5 | −0.9 pp |
| June 2013 | 95.4 | −1.6 pp |
| May 2013 | 97.0 | +1.3 pp |
| April 2013 | 95.7 | −3.3 pp |
| March 2013 | 99.0 | +5.4 pp |
| February 2013 | 93.6 | +0.5 pp |
| January 2013 | 93.1 | +1.9 pp |
| December 2012 | 91.2 | −2.8 pp |
| November 2012 | 94.0 | −2.2 pp |
| October 2012 | 96.2 | −3.0 pp |
| September 2012 | 99.2 | +1.0 pp |
| August 2012 | 98.2 | −0.9 pp |
| July 2012 | 99.1 | −1.7 pp |
| June 2012 | 100.8 | −2.6 pp |
| May 2012 | 103.4 | +0.8 pp |
| April 2012 | 102.6 | +2.5 pp |
| March 2012 | 100.1 | +2.4 pp |
| February 2012 | 97.7 | −3.2 pp |
| January 2012 | 100.9 | −0.2 pp |
| December 2011 | 101.1 | −0.1 pp |
| November 2011 | 101.2 | −1.7 pp |
| October 2011 | 102.9 | −0.1 pp |
| September 2011 | 103.0 | +1.9 pp |
| August 2011 | 101.1 | −6.4 pp |
| July 2011 | 107.5 | +2.2 pp |
| June 2011 | 105.3 | +0.3 pp |
| May 2011 | 105.0 | +1.4 pp |
| April 2011 | 103.6 | +8.0 pp |
| March 2011 | 95.6 | −8.3 pp |
| February 2011 | 103.9 | −1.8 pp |
| January 2011 | 105.7 |
Related indicators
Production and confidenceIndustrial production (annual change, calendar adjusted)
2.6%
September 2026 +4.5 pp
Consumer confidence index
86.8
November 2026 +2.0 pp
Economic confidence index
97.3
October 2026 −4.0 pp
Services confidence index (seasonally adjusted)
109.2
October 2026 −2.7 pp
Retail trade confidence index (seasonally adjusted)
112.5
October 2026 +1.2 pp
Retail sales volume (annual change, calendar adjusted)
7.7%
September 2026 −2.3 pp
What does this indicator measure?
The construction confidence index is calculated from TurkStat's monthly tendency survey of enterprises in the construction sector.
In TurkStat's bulletin the index is published together with two sub-indices: the current level of order books and expected total employment over the next 3 months.
The index ranges from 0 to 200. According to TurkStat, a value above 100 indicates optimism about the sector's current and future situation, and a value below 100 indicates pessimism. The series on this page is the seasonally adjusted index used in TurkStat's headline; it starts in 2011.
How to read it
- The index is a survey result; it shows the assessments and expectations of enterprises, not construction output. For realized output, see TurkStat's construction production index.
- Because seasonal adjustment is redone every month, values for earlier months can change slightly with new data. This page re-downloads the whole series at every update.
Common misreadings
- A value below 100 does not mean the sector is shrinking; it shows that pessimistic assessments outweigh optimistic ones in the survey answers.
- The construction confidence index does not measure house prices, house sales or construction costs.
Frequently asked questions
What is the construction confidence index in Turkey?
According to TurkStat, the seasonally adjusted construction confidence index was 83.3 in October 2026. In the previous month (September 2026) it was 83.0.
When will the construction confidence index be released?
The services, retail trade and construction confidence indices are released in the same TurkStat bulletin. According to TurkStat's release calendar, the next release is on Tuesday 24 November 2026, 10:00.
What does a value below 100 mean?
The index ranges from 0 to 200. According to TurkStat, a value below 100 indicates pessimism in the sector and a value above 100 indicates optimism.
Which sub-indices are published with it?
In TurkStat's bulletin it is published together with the current level of order books and expected total employment over the next 3 months.
Does the construction confidence index show house prices?
No. The index is the result of a survey of construction enterprises; it is not price or sales data.