Turkey female labor force participation rate
Female labor force participation rate (aged 15+) · Turkish Statistical Institute
Short answer
35.2%
September 2026 +0.2 pp
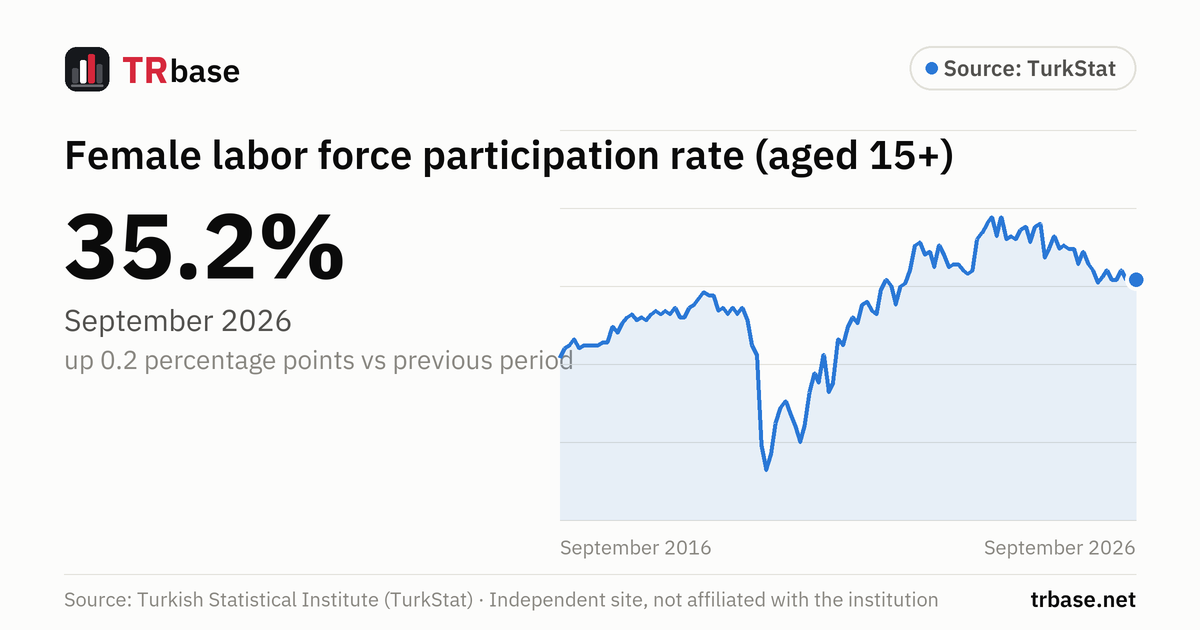
The seasonally adjusted labor force participation rate of women in Türkiye was 35.2% in September 2026. That is up 0.2 percentage points from the previous month.
- A year earlier (September 2025) it was 35.7%; the latest value is 0.5 percentage points lower.
Next release: Monday 30 November 2026, 10:00
Female labor force participation rate (aged 15+), January 2005 – September 2026
Unit: %. Source: Turkish Statistical Institute (TurkStat). Hover over the chart, or focus it and use the arrow keys.
Data table
All values in the chart, newest first. Unit: %.
| Period | Female participation (%) | Change vs previous period |
|---|---|---|
| September 2026 | 35.2 | +0.2 pp |
| August 2026 | 35.0 | −0.2 pp |
| July 2026 | 35.2 | −0.3 pp |
| June 2026 | 35.5 | +0.3 pp |
| May 2026 | 35.2 | 0.0 pp |
| April 2026 | 35.2 | −0.3 pp |
| March 2026 | 35.5 | +0.2 pp |
| February 2026 | 35.3 | +0.2 pp |
| January 2026 | 35.1 | −0.4 pp |
| December 2025 | 35.5 | −0.2 pp |
| November 2025 | 35.7 | −0.4 pp |
| October 2025 | 36.1 | +0.4 pp |
| September 2025 | 35.7 | −0.5 pp |
| August 2025 | 36.2 | 0.0 pp |
| July 2025 | 36.2 | −0.1 pp |
| June 2025 | 36.3 | +0.1 pp |
| May 2025 | 36.2 | −0.4 pp |
| April 2025 | 36.6 | +0.4 pp |
| March 2025 | 36.2 | +0.3 pp |
| February 2025 | 35.9 | −1.1 pp |
| January 2025 | 37.0 | +0.1 pp |
| December 2024 | 36.9 | +0.5 pp |
| November 2024 | 36.4 | −0.5 pp |
| October 2024 | 36.9 | +0.1 pp |
| September 2024 | 36.8 | +0.3 pp |
| August 2024 | 36.5 | −0.1 pp |
| July 2024 | 36.6 | +0.1 pp |
| June 2024 | 36.5 | −0.7 pp |
| May 2024 | 37.2 | +0.6 pp |
| April 2024 | 36.6 | −0.6 pp |
| March 2024 | 37.2 | +0.2 pp |
| February 2024 | 37.0 | +0.3 pp |
| January 2024 | 36.7 | +0.2 pp |
| December 2023 | 36.5 | +1.0 pp |
| November 2023 | 35.5 | +0.1 pp |
| October 2023 | 35.4 | −0.1 pp |
| September 2023 | 35.5 | −0.2 pp |
| August 2023 | 35.7 | 0.0 pp |
| July 2023 | 35.7 | +0.1 pp |
| June 2023 | 35.6 | −0.4 pp |
| May 2023 | 36.0 | −0.3 pp |
| April 2023 | 36.3 | +0.7 pp |
| March 2023 | 35.6 | −0.5 pp |
| February 2023 | 36.1 | +0.1 pp |
| January 2023 | 36.0 | −0.4 pp |
| December 2022 | 36.4 | +0.1 pp |
| November 2022 | 36.3 | +0.8 pp |
| October 2022 | 35.5 | +0.4 pp |
| September 2022 | 35.1 | +0.1 pp |
| August 2022 | 35.0 | +0.6 pp |
| July 2022 | 34.4 | −0.6 pp |
| June 2022 | 35.0 | −0.2 pp |
| May 2022 | 35.2 | +0.3 pp |
| April 2022 | 34.9 | +0.8 pp |
| March 2022 | 34.1 | −0.1 pp |
| February 2022 | 34.2 | −0.3 pp |
| January 2022 | 34.5 | +0.1 pp |
| December 2021 | 34.4 | +0.6 pp |
| November 2021 | 33.8 | −0.2 pp |
| October 2021 | 34.0 | +0.3 pp |
| September 2021 | 33.7 | +0.6 pp |
| August 2021 | 33.1 | −0.2 pp |
| July 2021 | 33.3 | +1.4 pp |
| June 2021 | 31.9 | +0.3 pp |
| May 2021 | 31.6 | −1.2 pp |
| April 2021 | 32.8 | +0.9 pp |
| March 2021 | 31.9 | −0.3 pp |
| February 2021 | 32.2 | +0.6 pp |
| January 2021 | 31.6 | +1.1 pp |
| December 2020 | 30.5 | +0.5 pp |
| November 2020 | 30.0 | −0.5 pp |
| October 2020 | 30.5 | −0.4 pp |
| September 2020 | 30.9 | −0.4 pp |
| August 2020 | 31.3 | +0.2 pp |
| July 2020 | 31.1 | +0.5 pp |
| June 2020 | 30.6 | +1.0 pp |
| May 2020 | 29.6 | +0.5 pp |
| April 2020 | 29.1 | −0.8 pp |
| March 2020 | 29.9 | −2.9 pp |
| February 2020 | 32.8 | −0.3 pp |
| January 2020 | 33.1 | −0.8 pp |
| December 2019 | 33.9 | −0.4 pp |
| November 2019 | 34.3 | +0.2 pp |
| October 2019 | 34.1 | −0.2 pp |
| September 2019 | 34.3 | +0.2 pp |
| August 2019 | 34.1 | −0.2 pp |
| July 2019 | 34.3 | +0.1 pp |
| June 2019 | 34.2 | −0.5 pp |
| May 2019 | 34.7 | 0.0 pp |
| April 2019 | 34.7 | −0.1 pp |
| March 2019 | 34.8 | +0.2 pp |
| February 2019 | 34.6 | +0.2 pp |
| January 2019 | 34.4 | +0.1 pp |
| December 2018 | 34.3 | +0.3 pp |
| November 2018 | 34.0 | 0.0 pp |
| October 2018 | 34.0 | −0.3 pp |
| September 2018 | 34.3 | +0.2 pp |
| August 2018 | 34.1 | −0.1 pp |
| July 2018 | 34.2 | +0.1 pp |
| June 2018 | 34.1 | −0.1 pp |
| May 2018 | 34.2 | +0.1 pp |
| April 2018 | 34.1 | +0.2 pp |
| March 2018 | 33.9 | −0.1 pp |
| February 2018 | 34.0 | +0.1 pp |
| January 2018 | 33.9 | −0.2 pp |
| December 2017 | 34.1 | +0.1 pp |
| November 2017 | 34.0 | +0.2 pp |
| October 2017 | 33.8 | +0.3 pp |
| September 2017 | 33.5 | −0.2 pp |
| August 2017 | 33.7 | +0.5 pp |
| July 2017 | 33.2 | 0.0 pp |
| June 2017 | 33.2 | +0.1 pp |
| May 2017 | 33.1 | 0.0 pp |
| April 2017 | 33.1 | 0.0 pp |
| March 2017 | 33.1 | 0.0 pp |
| February 2017 | 33.1 | +0.1 pp |
| January 2017 | 33.0 | −0.3 pp |
| December 2016 | 33.3 | +0.2 pp |
| November 2016 | 33.1 | +0.1 pp |
| October 2016 | 33.0 | +0.3 pp |
| September 2016 | 32.7 | +0.3 pp |
| August 2016 | 32.4 | +0.1 pp |
| July 2016 | 32.3 | +0.2 pp |
| June 2016 | 32.1 | 0.0 pp |
| May 2016 | 32.1 | +0.4 pp |
| April 2016 | 31.7 | −0.1 pp |
| March 2016 | 31.8 | +0.2 pp |
| February 2016 | 31.6 | −0.3 pp |
| January 2016 | 31.9 | −0.3 pp |
| December 2015 | 32.2 | +0.3 pp |
| November 2015 | 31.9 | +0.3 pp |
| October 2015 | 31.6 | +0.1 pp |
| September 2015 | 31.5 | +0.1 pp |
| August 2015 | 31.4 | +0.3 pp |
| July 2015 | 31.1 | −0.4 pp |
| June 2015 | 31.5 | +0.3 pp |
| May 2015 | 31.2 | 0.0 pp |
| April 2015 | 31.2 | +0.3 pp |
| March 2015 | 30.9 | +0.1 pp |
| February 2015 | 30.8 | +0.2 pp |
| January 2015 | 30.6 | −0.1 pp |
| December 2014 | 30.7 | +0.2 pp |
| November 2014 | 30.5 | +0.1 pp |
| October 2014 | 30.4 | +0.5 pp |
| September 2014 | 29.9 | +0.1 pp |
| August 2014 | 29.8 | +0.2 pp |
| July 2014 | 29.6 | −0.4 pp |
| June 2014 | 30.0 | +0.1 pp |
| May 2014 | 29.9 | 0.0 pp |
| April 2014 | 29.9 | +0.3 pp |
| March 2014 | 29.6 | +0.4 pp |
| February 2014 | 29.2 | +0.1 pp |
| January 2014 | 29.1 | +0.9 pp |
| December 2013 | 28.2 | +0.2 pp |
| November 2013 | 28.0 | +0.1 pp |
| October 2013 | 27.9 | +0.1 pp |
| September 2013 | 27.8 | +0.1 pp |
| August 2013 | 27.7 | 0.0 pp |
| July 2013 | 27.7 | 0.0 pp |
| June 2013 | 27.7 | −0.1 pp |
| May 2013 | 27.8 | −0.1 pp |
| April 2013 | 27.9 | −0.1 pp |
| March 2013 | 28.0 | 0.0 pp |
| February 2013 | 28.0 | +0.1 pp |
| January 2013 | 27.9 | +0.1 pp |
| December 2012 | 27.8 | +0.1 pp |
| November 2012 | 27.7 | +0.3 pp |
| October 2012 | 27.4 | +0.5 pp |
| September 2012 | 26.9 | +0.4 pp |
| August 2012 | 26.5 | +0.2 pp |
| July 2012 | 26.3 | −0.1 pp |
| June 2012 | 26.4 | 0.0 pp |
| May 2012 | 26.4 | +0.2 pp |
| April 2012 | 26.2 | +0.1 pp |
| March 2012 | 26.1 | +0.2 pp |
| February 2012 | 25.9 | 0.0 pp |
| January 2012 | 25.9 | −0.1 pp |
| December 2011 | 26.0 | 0.0 pp |
| November 2011 | 26.0 | −0.2 pp |
| October 2011 | 26.2 | −0.2 pp |
| September 2011 | 26.4 | −0.2 pp |
| August 2011 | 26.6 | +0.1 pp |
| July 2011 | 26.5 | +0.3 pp |
| June 2011 | 26.2 | +0.1 pp |
| May 2011 | 26.1 | +0.1 pp |
| April 2011 | 26.0 | 0.0 pp |
| March 2011 | 26.0 | 0.0 pp |
| February 2011 | 26.0 | +0.3 pp |
| January 2011 | 25.7 | +0.2 pp |
| December 2010 | 25.5 | +0.2 pp |
| November 2010 | 25.3 | +0.1 pp |
| October 2010 | 25.2 | 0.0 pp |
| September 2010 | 25.2 | 0.0 pp |
| August 2010 | 25.2 | +0.1 pp |
| July 2010 | 25.1 | +0.3 pp |
| June 2010 | 24.8 | 0.0 pp |
| May 2010 | 24.8 | −0.1 pp |
| April 2010 | 24.9 | −0.2 pp |
| March 2010 | 25.1 | −0.1 pp |
| February 2010 | 25.2 | +0.2 pp |
| January 2010 | 25.0 | +0.4 pp |
| December 2009 | 24.6 | +0.1 pp |
| November 2009 | 24.5 | +0.1 pp |
| October 2009 | 24.4 | 0.0 pp |
| September 2009 | 24.4 | +0.2 pp |
| August 2009 | 24.2 | +0.2 pp |
| July 2009 | 24.0 | +0.3 pp |
| June 2009 | 23.7 | +0.4 pp |
| May 2009 | 23.3 | 0.0 pp |
| April 2009 | 23.3 | 0.0 pp |
| March 2009 | 23.3 | +0.1 pp |
| February 2009 | 23.2 | +0.1 pp |
| January 2009 | 23.1 | +0.4 pp |
| December 2008 | 22.7 | +0.1 pp |
| November 2008 | 22.6 | +0.1 pp |
| October 2008 | 22.5 | 0.0 pp |
| September 2008 | 22.5 | 0.0 pp |
| August 2008 | 22.5 | +0.2 pp |
| July 2008 | 22.3 | +0.2 pp |
| June 2008 | 22.1 | +0.2 pp |
| May 2008 | 21.9 | +0.1 pp |
| April 2008 | 21.8 | +0.2 pp |
| March 2008 | 21.6 | +0.2 pp |
| February 2008 | 21.4 | +0.4 pp |
| January 2008 | 21.0 | +0.3 pp |
| December 2007 | 20.7 | +0.1 pp |
| November 2007 | 20.6 | −0.1 pp |
| October 2007 | 20.7 | −0.4 pp |
| September 2007 | 21.1 | −0.2 pp |
| August 2007 | 21.3 | −0.1 pp |
| July 2007 | 21.4 | −0.1 pp |
| June 2007 | 21.5 | 0.0 pp |
| May 2007 | 21.5 | −0.1 pp |
| April 2007 | 21.6 | 0.0 pp |
| March 2007 | 21.6 | −0.1 pp |
| February 2007 | 21.7 | +0.1 pp |
| January 2007 | 21.6 | −0.1 pp |
| December 2006 | 21.7 | +0.1 pp |
| November 2006 | 21.6 | 0.0 pp |
| October 2006 | 21.6 | 0.0 pp |
| September 2006 | 21.6 | −0.2 pp |
| August 2006 | 21.8 | −0.2 pp |
| July 2006 | 22.0 | +0.6 pp |
| June 2006 | 21.4 | 0.0 pp |
| May 2006 | 21.4 | +0.3 pp |
| April 2006 | 21.1 | +0.3 pp |
| March 2006 | 20.8 | +0.1 pp |
| February 2006 | 20.7 | −0.2 pp |
| January 2006 | 20.9 | −0.6 pp |
| December 2005 | 21.5 | −0.2 pp |
| November 2005 | 21.7 | 0.0 pp |
| October 2005 | 21.7 | +0.4 pp |
| September 2005 | 21.3 | +0.2 pp |
| August 2005 | 21.1 | +0.1 pp |
| July 2005 | 21.0 | −0.2 pp |
| June 2005 | 21.2 | −0.1 pp |
| May 2005 | 21.3 | +0.2 pp |
| April 2005 | 21.1 | +0.1 pp |
| March 2005 | 21.0 | 0.0 pp |
| February 2005 | 21.0 | −0.2 pp |
| January 2005 | 21.2 |
Related indicators
Labor marketUnemployment rate
8.4%
September 2026 +0.5 pp
Youth unemployment rate (aged 15-24)
14.8%
September 2026 +1.6 pp
Labor force participation rate (aged 15+)
52.7%
September 2026 +0.1 pp
Employment rate (aged 15+)
48.3%
September 2026 −0.1 pp
Number of employed persons (aged 15+)
32,445 thousand persons
September 2026 −0.15%
Composite measure of labor underutilization
31.2%
September 2026 +0.2 pp
What does this indicator measure?
The female labor force participation rate is the share of women in the labor force (employed, or looking for work and available to start) in the non-institutional female population aged 15 and over.
The data come from TurkStat's Household Labour Force Survey. The series on this page is seasonally adjusted and starts in 2005; according to TurkStat, the monthly results for 2005-2020 were estimated by a model.
For comparison, the chart also shows the male labor force participation rate and the female employment rate.
How to read it
- The rate shows how many of every 100 women aged 15 and over are working or looking for work.
- The female employment rate covers only women who work; the gap between the two rates comes from unemployed women in the labor force.
Common misreadings
- Women who are not in the labor force are not counted as unemployed; the unemployed are part of the labor force.
- Women engaged in housework who neither work for income nor look for work are not in the labor force; the rate does not measure unpaid housework.
- Seasonally adjusted series can be revised slightly backwards.
Frequently asked questions
What is the female labor force participation rate in Turkey?
According to TurkStat, the seasonally adjusted labor force participation rate of women was 35.2% in September 2026. In the previous month (August 2026) it was 35.0%.
How is the female labor force participation rate calculated?
The number of women in the labor force (employed, or looking for work and available to start) is divided by the non-institutional female population aged 15 and over and expressed as a percentage.
What is the difference between the female employment rate and the participation rate?
The participation rate also covers women looking for work; the employment rate covers only women who work. The chart on this page shows both rates.
What is the male labor force participation rate?
TurkStat publishes the rate for men in the same bulletin; it is shown as an additional series in the chart and table on this page.
When is the data updated?
The female labor force participation rate is part of the monthly Labour Force Statistics bulletin. According to TurkStat's release calendar, the next release is on: Monday 30 November 2026, 10:00.