Turkey household inflation expectations
Households' annual inflation expectation 12 months ahead (Sectoral Inflation Expectations) · Central Bank of the Republic of Türkiye
Short answer
43.75%
October 2026 −1.85 pp
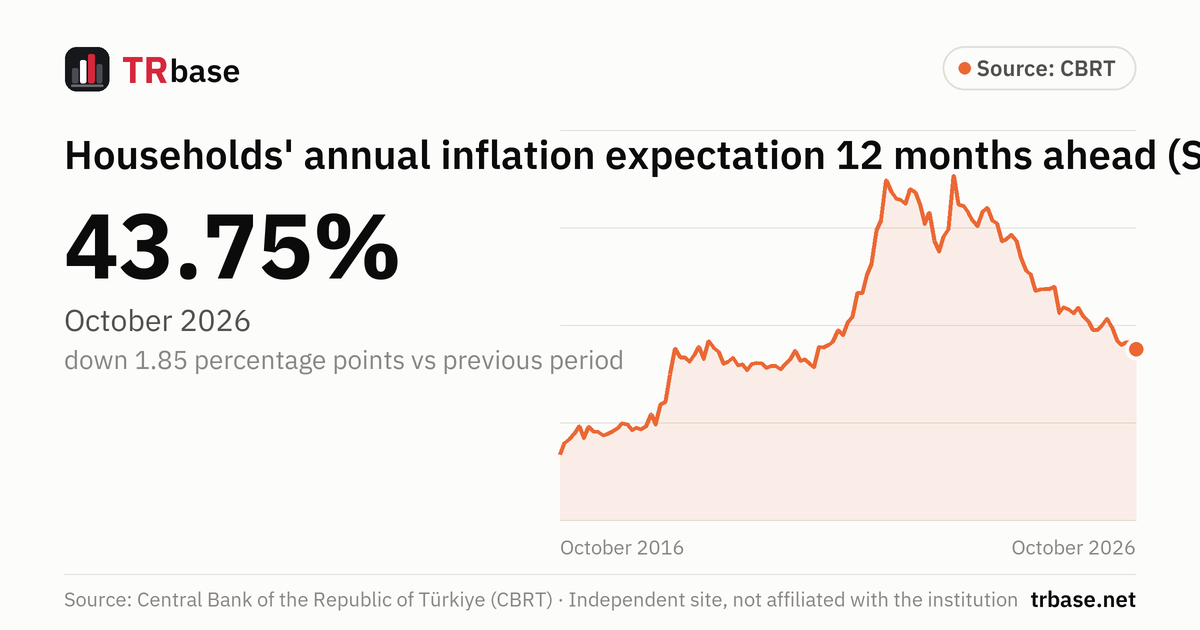
According to the CBRT's Sectoral Inflation Expectations, households' annual inflation expectation 12 months ahead was 43.75% in October 2026. That is down 1.85 percentage points from the previous month.
- This is the lowest value in the last 24 months.
- A year earlier (October 2025) it was 54.39%; the latest value is 10.64 percentage points lower.
Households' annual inflation expectation 12 months ahead (Sectoral Inflation Expectations), January 2015 – October 2026
Unit: %. Source: Central Bank of the Republic of Türkiye (CBRT). Hover over the chart, or focus it and use the arrow keys.
Data table
All values in the chart, newest first. Unit: %.
| Period | Household inflation expectations (%) | Change vs previous period |
|---|---|---|
| October 2026 | 43.75 | −1.85 pp |
| September 2026 | 45.60 | +0.02 pp |
| August 2026 | 45.58 | +0.64 pp |
| July 2026 | 44.94 | −1.19 pp |
| June 2026 | 46.13 | −3.38 pp |
| May 2026 | 49.51 | −2.05 pp |
| April 2026 | 51.56 | +1.67 pp |
| March 2026 | 49.89 | +1.08 pp |
| February 2026 | 48.81 | 0.00 pp |
| January 2026 | 48.81 | −2.09 pp |
| December 2025 | 50.90 | −1.34 pp |
| November 2025 | 52.24 | −2.15 pp |
| October 2025 | 54.39 | +1.40 pp |
| September 2025 | 52.99 | −1.08 pp |
| August 2025 | 54.07 | −0.46 pp |
| July 2025 | 54.53 | +1.54 pp |
| June 2025 | 52.99 | −6.87 pp |
| May 2025 | 59.86 | +0.56 pp |
| April 2025 | 59.30 | +0.05 pp |
| March 2025 | 59.25 | +0.07 pp |
| February 2025 | 59.18 | +0.36 pp |
| January 2025 | 58.82 | −4.32 pp |
| December 2024 | 63.14 | −0.91 pp |
| November 2024 | 64.05 | −3.18 pp |
| October 2024 | 67.23 | −4.33 pp |
| September 2024 | 71.56 | −1.58 pp |
| August 2024 | 73.14 | +1.16 pp |
| July 2024 | 71.98 | +0.49 pp |
| June 2024 | 71.49 | −4.60 pp |
| May 2024 | 76.09 | −0.59 pp |
| April 2024 | 76.68 | −3.33 pp |
| March 2024 | 80.01 | +0.91 pp |
| February 2024 | 79.10 | +3.81 pp |
| January 2024 | 75.29 | −1.48 pp |
| December 2023 | 76.77 | −1.97 pp |
| November 2023 | 78.74 | −1.89 pp |
| October 2023 | 80.63 | −0.31 pp |
| September 2023 | 80.94 | −7.33 pp |
| August 2023 | 88.27 | +13.74 pp |
| July 2023 | 74.53 | +1.88 pp |
| June 2023 | 72.65 | +3.87 pp |
| May 2023 | 68.78 | −2.80 pp |
| April 2023 | 71.58 | −7.18 pp |
| March 2023 | 78.76 | +2.88 pp |
| February 2023 | 75.88 | −4.72 pp |
| January 2023 | 80.60 | −3.44 pp |
| December 2022 | 84.04 | −0.79 pp |
| November 2022 | 84.83 | +3.76 pp |
| October 2022 | 81.07 | −0.99 pp |
| September 2022 | 82.06 | −0.49 pp |
| August 2022 | 82.55 | −1.63 pp |
| July 2022 | 84.18 | −2.95 pp |
| June 2022 | 87.13 | +10.28 pp |
| May 2022 | 76.85 | +2.54 pp |
| April 2022 | 74.31 | +8.66 pp |
| March 2022 | 65.65 | +2.81 pp |
| February 2022 | 62.84 | +4.52 pp |
| January 2022 | 58.32 | +0.10 pp |
| December 2021 | 58.22 | +6.07 pp |
| November 2021 | 52.15 | +1.38 pp |
| October 2021 | 50.77 | +3.36 pp |
| September 2021 | 47.41 | −1.25 pp |
| August 2021 | 48.66 | +2.85 pp |
| July 2021 | 45.81 | +0.91 pp |
| June 2021 | 44.90 | +0.59 pp |
| May 2021 | 44.31 | −0.15 pp |
| April 2021 | 44.46 | +5.23 pp |
| March 2021 | 39.23 | −0.88 pp |
| February 2021 | 40.11 | −1.11 pp |
| January 2021 | 41.22 | +0.43 pp |
| December 2020 | 40.79 | −2.61 pp |
| November 2020 | 43.40 | +2.16 pp |
| October 2020 | 41.24 | +1.19 pp |
| September 2020 | 40.05 | +1.41 pp |
| August 2020 | 38.64 | −0.97 pp |
| July 2020 | 39.61 | +0.05 pp |
| June 2020 | 39.56 | +0.54 pp |
| May 2020 | 39.02 | −1.16 pp |
| April 2020 | 40.18 | −0.14 pp |
| March 2020 | 40.32 | +0.25 pp |
| February 2020 | 40.07 | +1.71 pp |
| January 2020 | 38.36 | −1.63 pp |
| December 2019 | 39.99 | +0.34 pp |
| November 2019 | 39.65 | −2.00 pp |
| October 2019 | 41.65 | +1.03 pp |
| September 2019 | 40.62 | +0.51 pp |
| August 2019 | 40.11 | −3.16 pp |
| July 2019 | 43.27 | −1.00 pp |
| June 2019 | 44.27 | −1.51 pp |
| May 2019 | 45.78 | +4.57 pp |
| April 2019 | 41.21 | −3.25 pp |
| March 2019 | 44.46 | +2.09 pp |
| February 2019 | 42.37 | +1.74 pp |
| January 2019 | 40.63 | −1.16 pp |
| December 2018 | 41.79 | +0.08 pp |
| November 2018 | 41.71 | −2.23 pp |
| October 2018 | 43.94 | +6.60 pp |
| September 2018 | 37.34 | +7.05 pp |
| August 2018 | 30.29 | +0.65 pp |
| July 2018 | 29.64 | +5.17 pp |
| June 2018 | 24.47 | −2.63 pp |
| May 2018 | 27.10 | +3.04 pp |
| April 2018 | 24.06 | +0.82 pp |
| March 2018 | 23.24 | −0.41 pp |
| February 2018 | 23.65 | +0.64 pp |
| January 2018 | 23.01 | −1.52 pp |
| December 2017 | 24.53 | −0.29 pp |
| November 2017 | 24.82 | +1.24 pp |
| October 2017 | 23.58 | +0.79 pp |
| September 2017 | 22.79 | +0.71 pp |
| August 2017 | 22.08 | +0.41 pp |
| July 2017 | 21.67 | −0.96 pp |
| June 2017 | 22.63 | −0.10 pp |
| May 2017 | 22.73 | −1.21 pp |
| April 2017 | 23.94 | +3.00 pp |
| March 2017 | 20.94 | −3.05 pp |
| February 2017 | 23.99 | +1.79 pp |
| January 2017 | 22.20 | +1.32 pp |
| December 2016 | 20.88 | +1.06 pp |
| November 2016 | 19.82 | +3.12 pp |
| October 2016 | 16.70 | −0.22 pp |
| September 2016 | 16.92 | −4.51 pp |
| August 2016 | 21.43 | −1.60 pp |
| July 2016 | 23.03 | +1.33 pp |
| June 2016 | 21.70 | −0.64 pp |
| May 2016 | 22.34 | −0.42 pp |
| April 2016 | 22.76 | −0.74 pp |
| March 2016 | 23.50 | −0.66 pp |
| February 2016 | 24.16 | +0.98 pp |
| January 2016 | 23.18 | +1.83 pp |
| December 2015 | 21.35 | −0.86 pp |
| November 2015 | 22.21 | −2.34 pp |
| October 2015 | 24.55 | −2.90 pp |
| September 2015 | 27.45 | +4.32 pp |
| August 2015 | 23.13 | −1.09 pp |
| July 2015 | 24.22 | +0.59 pp |
| June 2015 | 23.63 | −4.37 pp |
| May 2015 | 28.00 | +3.38 pp |
| April 2015 | 24.62 | −2.68 pp |
| March 2015 | 27.30 | +3.65 pp |
| February 2015 | 23.65 | +1.30 pp |
| January 2015 | 22.35 |
Households, real sector and market participants (%)
| Period | Household inflation expectations | Real sector | Market participants |
|---|---|---|---|
| October 2026 | 43.75 | 31.80 | 23.89 |
| September 2026 | 45.60 | 32.50 | 23.70 |
| August 2026 | 45.58 | 32.80 | 23.69 |
| July 2026 | 44.94 | 32.50 | 23.95 |
| June 2026 | 46.13 | 33.10 | 23.81 |
| May 2026 | 49.51 | 33.10 | 23.82 |
| April 2026 | 51.56 | 33.70 | 23.39 |
| March 2026 | 49.89 | 32.90 | 22.17 |
| February 2026 | 48.81 | 32.00 | 22.10 |
| January 2026 | 48.81 | 32.90 | 22.20 |
| December 2025 | 50.90 | 34.80 | 23.35 |
| November 2025 | 52.24 | 35.70 | 23.49 |
| October 2025 | 54.39 | 36.30 | 23.26 |
| September 2025 | 52.99 | 36.80 | 22.25 |
| August 2025 | 54.07 | 37.70 | 22.84 |
| July 2025 | 54.53 | 39.00 | 23.39 |
| June 2025 | 52.99 | 39.80 | 24.56 |
| May 2025 | 59.86 | 41.00 | 25.06 |
| April 2025 | 59.30 | 41.70 | 25.56 |
| March 2025 | 59.25 | 41.10 | 24.55 |
| February 2025 | 59.18 | 41.90 | 25.26 |
| January 2025 | 58.82 | 43.80 | 25.38 |
| December 2024 | 63.14 | 47.60 | 27.07 |
| November 2024 | 64.05 | 47.80 | 27.20 |
| October 2024 | 67.23 | 49.50 | 27.44 |
| September 2024 | 71.56 | 51.10 | 27.49 |
| August 2024 | 73.14 | 53.80 | 28.71 |
| July 2024 | 71.98 | 55.00 | 30.02 |
| June 2024 | 71.49 | 56.20 | 31.79 |
| May 2024 | 76.09 | 56.00 | 33.21 |
| April 2024 | 76.68 | 56.20 | 35.17 |
| March 2024 | 80.01 | 55.80 | 36.70 |
| February 2024 | 79.10 | 55.50 | 37.78 |
| January 2024 | 75.29 | 55.50 | 39.09 |
| December 2023 | 76.77 | 57.90 | 41.23 |
| November 2023 | 78.74 | 59.20 | 43.94 |
| October 2023 | 80.63 | 58.70 | 45.28 |
| September 2023 | 80.94 | 58.60 | 44.94 |
| August 2023 | 88.27 | 57.60 | 42.01 |
| July 2023 | 74.53 | 49.90 | 33.21 |
| June 2023 | 72.65 | 51.40 | 30.65 |
| May 2023 | 68.78 | 53.00 | 29.84 |
| April 2023 | 71.58 | 55.50 | 31.02 |
| March 2023 | 78.76 | 57.10 | 31.63 |
| February 2023 | 75.88 | 57.30 | 30.75 |
| January 2023 | 80.60 | 60.60 | 30.44 |
| December 2022 | 84.04 | 67.50 | 34.92 |
| November 2022 | 84.83 | 70.10 | 37.47 |
| October 2022 | 81.07 | 68.90 | 37.34 |
| September 2022 | 82.06 | 67.10 | 36.74 |
| August 2022 | 82.55 | 65.70 | 41.99 |
| July 2022 | 84.18 | 63.40 | 40.23 |
| June 2022 | 87.13 | 61.10 | 37.91 |
| May 2022 | 76.85 | 53.90 | 33.28 |
| April 2022 | 74.31 | 48.60 | 28.41 |
| March 2022 | 65.65 | 40.10 | 26.43 |
| February 2022 | 62.84 | 36.00 | 24.83 |
| January 2022 | 58.32 | 30.70 | 25.37 |
| December 2021 | 58.22 | 24.60 | 21.39 |
| November 2021 | 52.15 | 20.70 | 15.61 |
| October 2021 | 50.77 | 18.80 | 13.91 |
| September 2021 | 47.41 | 17.90 | 12.94 |
| August 2021 | 48.66 | 17.20 | 12.48 |
| July 2021 | 45.81 | 16.90 | 12.62 |
| June 2021 | 44.90 | 16.50 | 12.12 |
| May 2021 | 44.31 | 16.40 | 11.81 |
| April 2021 | 44.46 | 15.80 | 11.26 |
| March 2021 | 39.23 | 14.60 | 10.47 |
| February 2021 | 40.11 | 14.40 | 10.36 |
| January 2021 | 41.22 | 14.50 | 10.53 |
| December 2020 | 40.79 | 14.40 | 10.84 |
| November 2020 | 43.40 | 14.10 | 10.77 |
| October 2020 | 41.24 | 13.50 | 10.53 |
| September 2020 | 40.05 | 13.30 | 10.15 |
| August 2020 | 38.64 | 13.10 | 9.70 |
| July 2020 | 39.61 | 12.90 | 9.33 |
| June 2020 | 39.56 | 12.80 | 9.03 |
| May 2020 | 39.02 | 12.90 | 9.20 |
| April 2020 | 40.18 | 13.50 | 9.70 |
| March 2020 | 40.32 | 13.20 | 9.51 |
| February 2020 | 40.07 | 13.00 | 9.61 |
| January 2020 | 38.36 | 13.10 | 9.54 |
| December 2019 | 39.99 | 13.70 | 10.07 |
| November 2019 | 39.65 | 14.20 | 10.46 |
| October 2019 | 41.65 | 15.20 | 11.18 |
| September 2019 | 40.62 | 16.60 | 12.21 |
| August 2019 | 40.11 | 17.10 | 12.77 |
| July 2019 | 43.27 | 18.00 | 13.90 |
| June 2019 | 44.27 | 19.00 | 14.88 |
| May 2019 | 45.78 | 19.70 | 15.48 |
| April 2019 | 41.21 | 19.20 | 15.38 |
| March 2019 | 44.46 | 19.10 | 15.24 |
| February 2019 | 42.37 | 19.30 | 15.47 |
| January 2019 | 40.63 | 19.60 | 15.91 |
| December 2018 | 41.79 | 20.30 | 16.46 |
| November 2018 | 41.71 | 22.10 | 17.38 |
| October 2018 | 43.94 | 22.10 | 17.03 |
| September 2018 | 37.34 | 18.00 | 14.46 |
| August 2018 | 30.29 | 15.00 | 12.96 |
| July 2018 | 29.64 | 13.60 | 11.07 |
| June 2018 | 24.47 | 12.40 | 10.47 |
| May 2018 | 27.10 | 11.50 | 10.15 |
| April 2018 | 24.06 | 11.40 | 9.62 |
| March 2018 | 23.24 | 10.90 | 9.24 |
| February 2018 | 23.65 | 10.90 | 9.26 |
| January 2018 | 23.01 | 11.10 | 9.24 |
| December 2017 | 24.53 | 11.20 | 9.30 |
| November 2017 | 24.82 | 10.60 | 8.65 |
| October 2017 | 23.58 | 10.30 | 8.52 |
| September 2017 | 22.79 | 10.10 | 8.35 |
| August 2017 | 22.08 | 10.00 | 8.37 |
| July 2017 | 21.67 | 10.20 | 8.41 |
| June 2017 | 22.63 | 10.30 | 8.32 |
| May 2017 | 22.73 | 10.20 | 8.41 |
| April 2017 | 23.94 | 10.10 | 8.27 |
| March 2017 | 20.94 | 9.60 | 8.15 |
| February 2017 | 23.99 | 9.40 | 8.21 |
| January 2017 | 22.20 | 9.30 | 8.19 |
| December 2016 | 20.88 | 8.90 | 8.04 |
| November 2016 | 19.82 | 8.70 | 7.87 |
| October 2016 | 16.70 | 8.60 | 7.61 |
| September 2016 | 16.92 | 8.70 | 7.62 |
| August 2016 | 21.43 | 8.80 | 7.61 |
| July 2016 | 23.03 | 8.60 | 7.59 |
| June 2016 | 21.70 | 8.60 | 7.60 |
| May 2016 | 22.34 | 8.70 | 7.81 |
| April 2016 | 22.76 | 8.70 | 7.78 |
| March 2016 | 23.50 | 9.00 | 7.89 |
| February 2016 | 24.16 | 9.10 | 7.96 |
| January 2016 | 23.18 | 8.90 | 7.92 |
| December 2015 | 21.35 | 8.70 | 7.56 |
| November 2015 | 22.21 | 8.60 | 7.42 |
| October 2015 | 24.55 | 8.70 | 7.34 |
| September 2015 | 27.45 | 8.70 | 7.25 |
| August 2015 | 23.13 | 8.60 | 7.04 |
| July 2015 | 24.22 | 8.70 | 7.05 |
| June 2015 | 23.63 | 8.90 | 7.00 |
| May 2015 | 28.00 | 8.60 | 6.85 |
| April 2015 | 24.62 | 8.50 | 6.91 |
| March 2015 | 27.30 | 8.60 | 6.78 |
| February 2015 | 23.65 | 8.40 | 6.69 |
| January 2015 | 22.35 | 8.60 | 6.81 |
Related indicators
Prices and inflationAnnual consumer price inflation (CPI)
29.77%
October 2026 +0.04 pp
Monthly inflation (CPI, monthly change)
2.58%
October 2026 +0.74 pp
Domestic Producer Price Index (D-PPI, annual change)
27.41%
October 2026 +0.03 pp
Construction cost index (annual change)
30.80%
September 2026 +1.21 pp
Core inflation (special CPI aggregate C, annual)
28.28%
October 2026 −0.42 pp
Food inflation (food and non-alcoholic beverages, annual)
27.73%
October 2026 +0.11 pp
What does this indicator measure?
Sectoral Inflation Expectations is a CBRT statistic that publishes together the annual consumer inflation expectations 12 months ahead compiled through three separate surveys: the Survey of Market Participants (experts from the financial and real sectors), the Business Tendency Survey (manufacturing workplaces) and the Household Expectations Survey (households), conducted jointly by the CBRT and TurkStat.
The main value on this page is the households' expectation; the expectations of the real sector and market participants are also shown in the chart. The series start in January 2015.
According to the CBRT's metadata, the household expectation is calculated from Consumer Tendency Survey data for 2015-2025 and from Household Expectations Survey data from January 2026. In the Household Expectations Survey, responses are collected by telephone within two weeks after the CPI release of the relevant month.
How to read it
- The expectation refers to 12 months after the survey month: the October 2026 value is the expectation for annual inflation in October 2027.
- The change in the table is the difference in percentage points from the previous month.
- Because the data source of the household series changed in January 2026, care is needed when comparing values before and after that date.
Common misreadings
- This value is not actual inflation but the expectation of surveyed households. Actual inflation is announced by TurkStat.
- The three groups' expectations are compiled through different surveys and methods; the gap between them should not be read as the result of a single survey.
- Market participants' current year-end inflation expectation is a different question from the 12-month-ahead expectation on this page.
Frequently asked questions
What are household inflation expectations in Turkey?
According to the CBRT's Sectoral Inflation Expectations, households' annual inflation expectation 12 months ahead was 43.75% in October 2026. In the previous month (September 2026) it was 45.60%.
When are sectoral inflation expectations released?
The CBRT publishes Sectoral Inflation Expectations every month as a report and as time series in EVDS. According to the CBRT's metadata, household responses are collected within two weeks after the CPI release of the relevant month. Our site checks the data every day; the latest published period is October 2026.
What is the real sector's inflation expectation?
The real sector's annual inflation expectation 12 months ahead is shown in the "Households, real sector and market participants" view of the chart and in the table. This series is the expectation of manufacturing workplaces responding to the Business Tendency Survey.
How is the household expectation compiled?
Through the Household Expectations Survey conducted jointly by the CBRT and TurkStat. According to the CBRT's metadata, the survey is carried out with individuals aged 18 and over using computer-assisted telephone interviewing. Values for 2015-2025 were calculated from Consumer Tendency Survey data.
Which period does the expectation refer to?
12 months after the survey month. For example, the October 2026 value is the expectation for annual consumer inflation in October 2027.