Turkey imports
Imports (monthly, general trade system) · Turkish Statistical Institute
Short answer
31.13 USD bn
September 2026 +8.45%
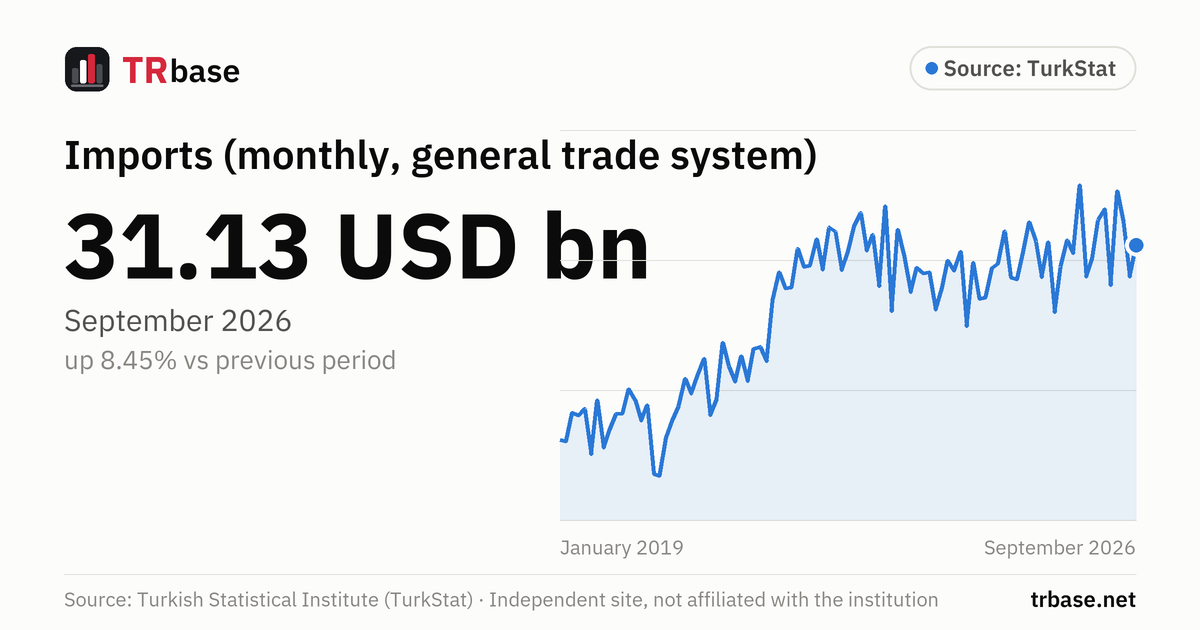
According to TurkStat data, Türkiye's imports were 31.13 USD bn in September 2026. That is up 8.45% from the previous month.
- A year earlier (September 2025) it was 29.47 USD bn; the latest value is 5.63% higher.
Next release: Monday 30 November 2026, 10:00
Imports (monthly, general trade system), January 2019 – September 2026
Unit: USD billion. Source: Turkish Statistical Institute (TurkStat). Hover over the chart, or focus it and use the arrow keys.
Data table
All values in the chart, newest first. Unit: USD billion.
| Period | Imports (USD billion) | Change vs previous period |
|---|---|---|
| September 2026 | 31.13 | +8.45% |
| August 2026 | 28.70 | −12.92% |
| July 2026 | 32.97 | −6.56% |
| June 2026 | 35.28 | +25.68% |
| May 2026 | 28.07 | −17.22% |
| April 2026 | 33.91 | +2.52% |
| March 2026 | 33.08 | +9.98% |
| February 2026 | 30.08 | +4.82% |
| January 2026 | 28.70 | −19.70% |
| December 2025 | 35.74 | +17.10% |
| November 2025 | 30.52 | −3.15% |
| October 2025 | 31.51 | +6.92% |
| September 2025 | 29.47 | +13.42% |
| August 2025 | 25.98 | −17.17% |
| July 2025 | 31.37 | +9.36% |
| June 2025 | 28.69 | −8.81% |
| May 2025 | 31.46 | −4.36% |
| April 2025 | 32.89 | +7.49% |
| March 2025 | 30.60 | +7.28% |
| February 2025 | 28.52 | −0.46% |
| January 2025 | 28.66 | −11.06% |
| December 2024 | 32.22 | +8.31% |
| November 2024 | 29.75 | +1.13% |
| October 2024 | 29.41 | +8.46% |
| September 2024 | 27.12 | +0.41% |
| August 2024 | 27.00 | −9.32% |
| July 2024 | 29.78 | +19.58% |
| June 2024 | 24.90 | −18.74% |
| May 2024 | 30.65 | +5.02% |
| April 2024 | 29.18 | −2.56% |
| March 2024 | 29.95 | +7.51% |
| February 2024 | 27.86 | +6.39% |
| January 2024 | 26.19 | −9.88% |
| December 2023 | 29.06 | +0.29% |
| November 2023 | 28.97 | −1.48% |
| October 2023 | 29.41 | +6.91% |
| September 2023 | 27.51 | −9.13% |
| August 2023 | 30.27 | −6.32% |
| July 2023 | 32.31 | +23.93% |
| June 2023 | 26.07 | −23.60% |
| May 2023 | 34.13 | +21.93% |
| April 2023 | 27.99 | −12.37% |
| March 2023 | 31.94 | +4.05% |
| February 2023 | 30.70 | −8.70% |
| January 2023 | 33.62 | +3.10% |
| December 2022 | 32.61 | +6.38% |
| November 2022 | 30.66 | +4.98% |
| October 2022 | 29.20 | −9.32% |
| September 2022 | 32.20 | −1.01% |
| August 2022 | 32.53 | +11.26% |
| July 2022 | 29.24 | −7.46% |
| June 2022 | 31.59 | +6.78% |
| May 2022 | 29.59 | +0.37% |
| April 2022 | 29.48 | −4.53% |
| March 2022 | 30.88 | +10.73% |
| February 2022 | 27.89 | +0.15% |
| January 2022 | 27.84 | −4.20% |
| December 2021 | 29.07 | +8.04% |
| November 2021 | 26.90 | +21.05% |
| October 2021 | 22.22 | −4.71% |
| September 2021 | 23.32 | +0.66% |
| August 2021 | 23.17 | +12.00% |
| July 2021 | 20.69 | −8.51% |
| June 2021 | 22.61 | +9.63% |
| May 2021 | 20.62 | −5.55% |
| April 2021 | 21.84 | −7.56% |
| March 2021 | 23.62 | +22.39% |
| February 2021 | 19.30 | +6.84% |
| January 2021 | 18.07 | −19.31% |
| December 2020 | 22.39 | +5.88% |
| November 2020 | 21.14 | +7.25% |
| October 2020 | 19.71 | −5.43% |
| September 2020 | 20.85 | +11.14% |
| August 2020 | 18.76 | +5.86% |
| July 2020 | 17.72 | +8.58% |
| June 2020 | 16.32 | +21.83% |
| May 2020 | 13.39 | −1.22% |
| April 2020 | 13.56 | −27.96% |
| March 2020 | 18.82 | +6.68% |
| February 2020 | 17.64 | −8.17% |
| January 2020 | 19.21 | −4.19% |
| December 2019 | 20.05 | +10.02% |
| November 2019 | 18.23 | +0.29% |
| October 2019 | 18.18 | +7.29% |
| September 2019 | 16.94 | +8.85% |
| August 2019 | 15.56 | −19.06% |
| July 2019 | 19.23 | +27.65% |
| June 2019 | 15.06 | −18.76% |
| May 2019 | 18.54 | +2.60% |
| April 2019 | 18.07 | −0.97% |
| March 2019 | 18.25 | +13.66% |
| February 2019 | 16.06 | −0.67% |
| January 2019 | 16.16 |
Related indicators
Trade, tourism and current accountExports (monthly, general trade system)
25.97 USD bn
September 2026 +10.72%
Foreign trade deficit (monthly, general trade system)
5.16 USD bn
September 2026 −1.71%
Tourism income (quarterly)
25.53 USD bn
2026 Q3 +60.83%
Exports to imports coverage ratio (monthly, general trade system)
83.4%
September 2026 +1.7 pp
Terms of trade (export unit value / import unit value)
88.0
September 2026 −2.0 pp
Current account balance (monthly)
2,720 USD mn
September 2026 −1,858 USD mn
What does this indicator measure?
Imports are purchases of goods from other countries by persons and institutions resident in Türkiye. Values are given in US dollars on a CIF basis. Imports of services are not within the scope of foreign trade statistics.
This page shows imports by the general trade system, which TurkStat uses in its headline. The data are provisional data produced in cooperation between TurkStat and the Ministry of Trade. The monthly series is compiled from TurkStat's bulletin tables from January 2019 onward.
How to read it
- Monthly imports are affected by the number of working days and by the season; it helps to compare a month with the same month of last year.
- TurkStat also gives imports excluding energy products and non-monetary gold in the bulletin.
Common misreadings
- The CIF value includes freight and insurance; keep this difference in mind when comparing directly with FOB-based exports.
- Monthly data are provisional; there may be small revisions in later bulletins.
Frequently asked questions
How much did Turkey import?
According to TurkStat data, imports by the general trade system were 31.13 USD bn in September 2026. In the previous month (August 2026) they were 28.70 USD bn.
When will import figures be announced?
Imports are announced together with exports in the Foreign Trade Statistics bulletin. According to TurkStat's release calendar, the next release is on: Monday 30 November 2026, 10:00.
What does CIF mean?
In addition to the price of the goods, the CIF value also includes freight and insurance costs up to the border of the destination country.
Which trade system is used?
The general trade system, which TurkStat uses in its headline. This system also covers free zones and customs warehouses.